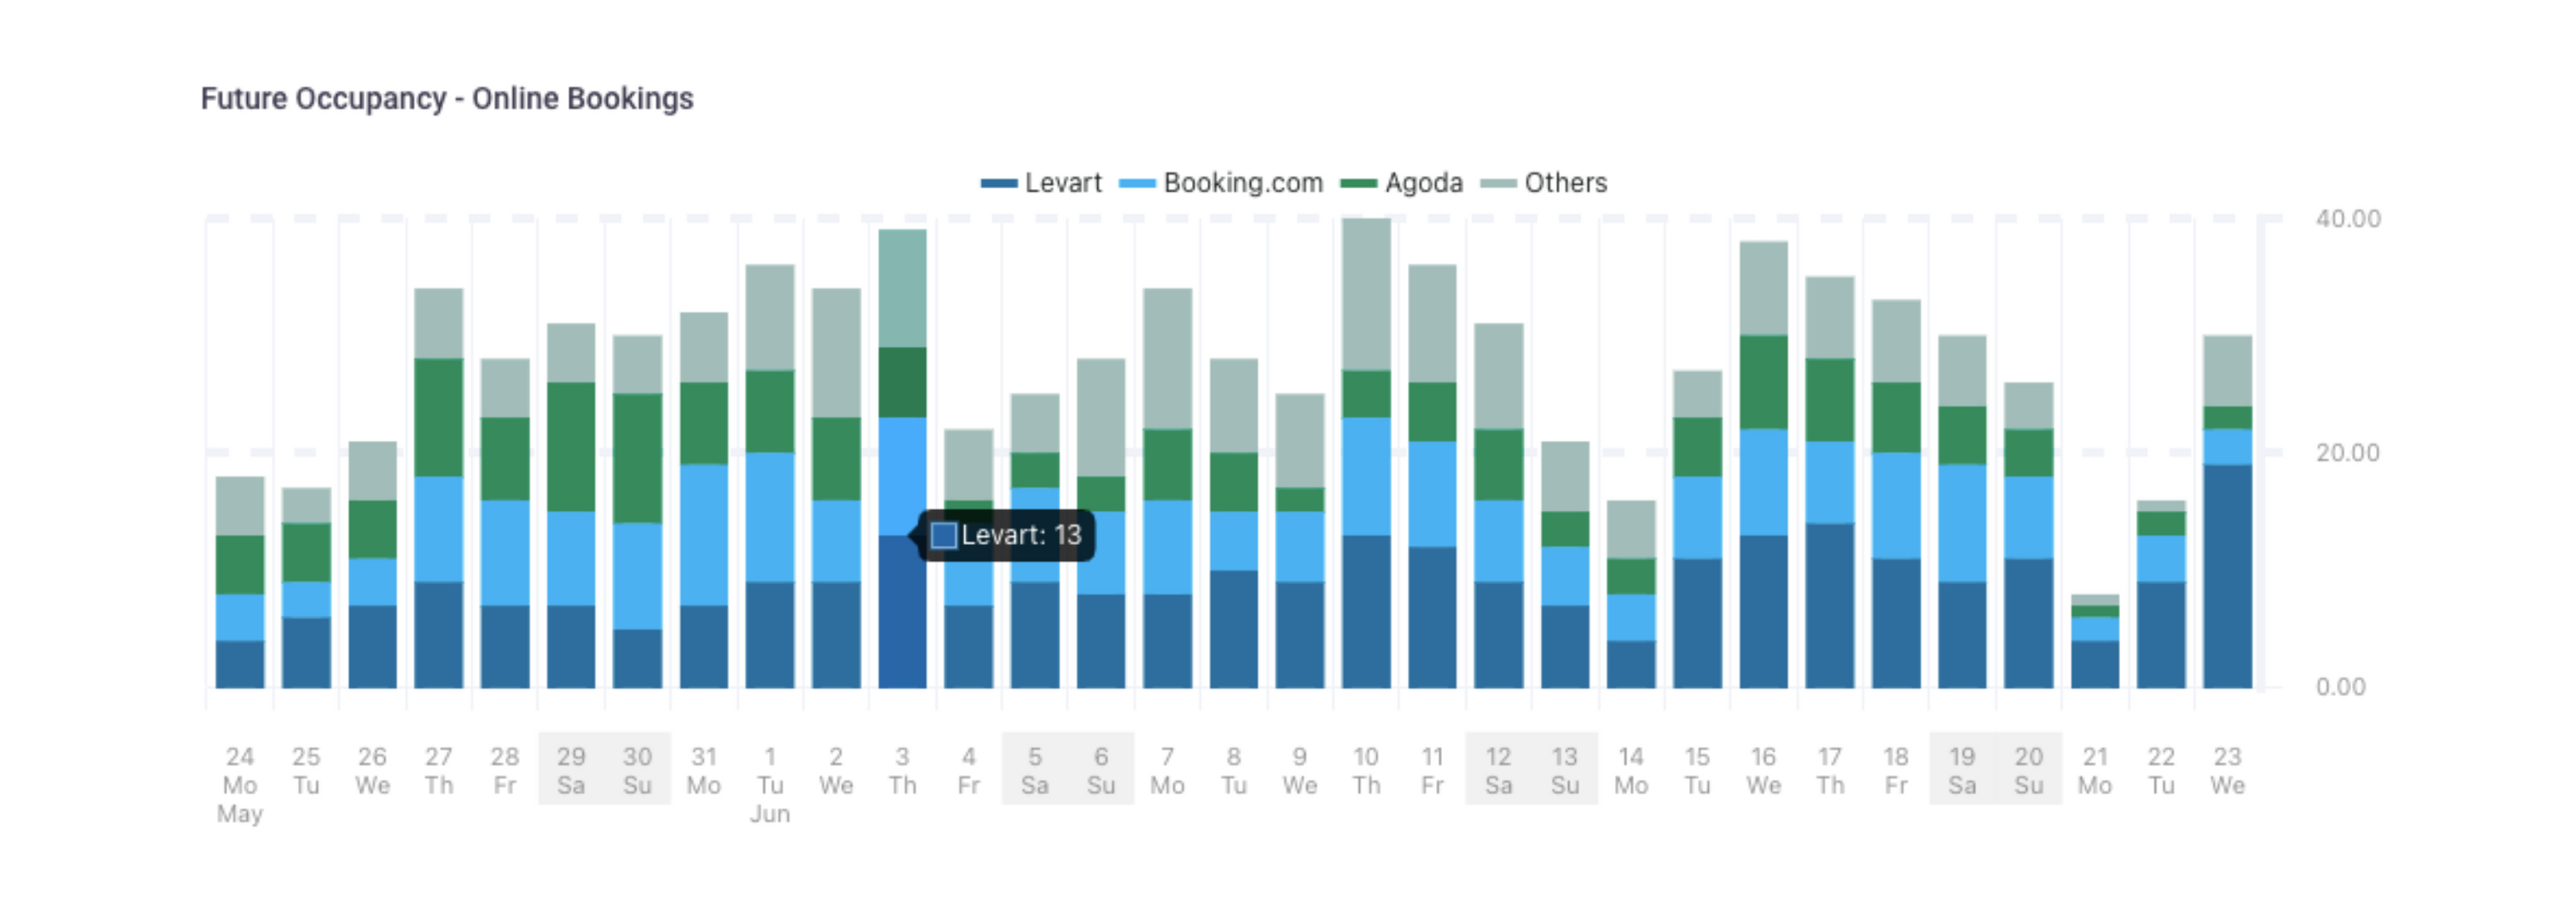
The Future Occupancy-Online Bookings graph allows you to see an overview of your online booking sources by day and how these contribute to your total occupancy.
The aim of this development is to enable properties to make more informed decisions based on valuable data insights.
This graph is accessible on the dashboard page of your Levart admin.
Steps to take
To make the most of this feature, you will need to input the physical room count for each room type. This will enable occupancy to display as a percentage in the graph.
To do this, go to Room Types > Properties and set the Physical Room Count.
Repeat for each individual room type.
Additional features
Planned additional features to enhance the functionality of this graph will be released periodically. These include:
- The ability to compare occupancy between years
- Hover over indications of all channels and total occupancy figures
- Tick boxes to add rooms sold offline to the occupancy graph
- Actionable menu to change rates and create specials for particular dates
- Ability to see booking details for individual dates